Custom Dashboards
DRUID custom dashboards provide a powerful way to visualize and manage your data in one centralized location. By customizing your dashboard, you can focus on the metrics and information most relevant to your role, improving efficiency and decision-making. Whether you need to track the service desk performance, monitor tasks, or analyze accounts, DRUID custom dashboards offer the flexibility to tailor your view to meet your specific needs.
Creating custom dashboards
Before creating custom dashboards, make sure that you created web views and charts and integrations to show records and data from DRUID Data Service and third-party systems.
To create a custom dashboard, follow these steps:
- Select the bot and solution.
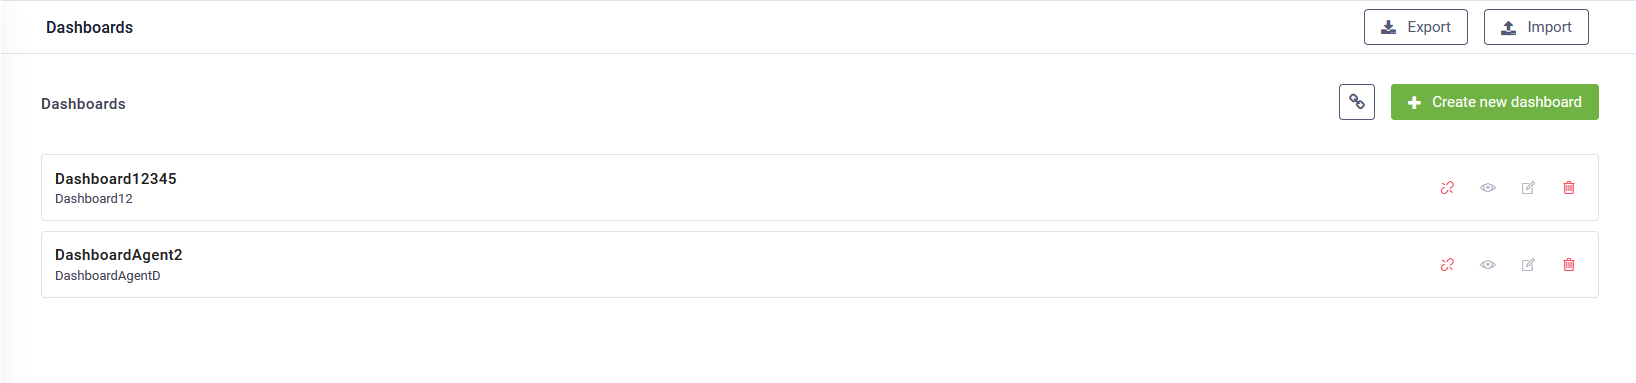
- From Solution Contents menu, click Dashboards.
- At the top-right corner of the Dashboards page, click the Create new dashboard button.
- Enter a Name and Description and click Save.
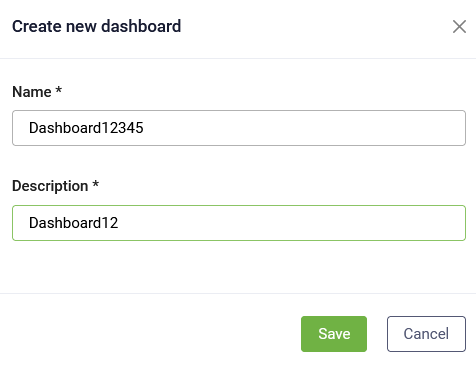
The new dashboards appears on the Dashboards page.
Customizing the custom dashboards
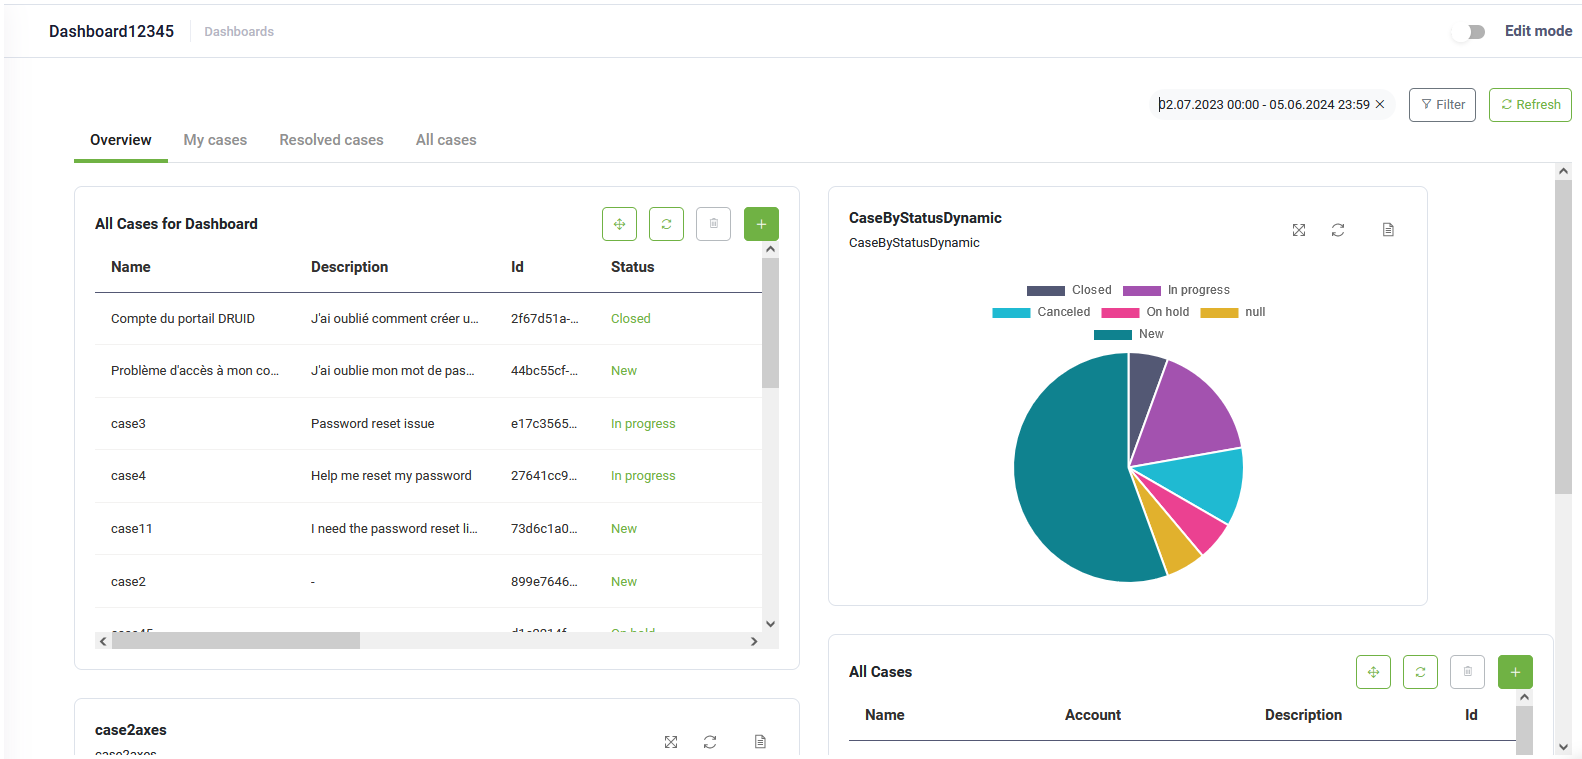
To edit the dashboard template, on the top-right corner of the Dashboard, tap on Edit mode.
The Dashboard becomes editable: a toolbar appears at the bottom and all dashboard widgets become editable. You can navigate through dashboard pages and edit the dashboard pages according to your needs.
The toolbar provides you with the following options:
|
|
Add a new widget on the dashboard page. |
|
|
Add a new dashboard page. |
|
|
Rename the current dashboard page. |
|
|
Delete the current dashboard page. IMPORTANT! This action cannot be undone. Make sure that you really want to delete the current dashboard page.
|
|
|
Saves the current dashboard page customization and exists the edit mode. |
|
|
Cancels dashboard page customizations (new or existing widgets, reordering, etc.) and exists the edit mode. |


Adding widgets
To add a widget, click the Add widget button ( ) on the toolbar. The Add widget page appears.
Select the desired widget type: Table (web view), Chart or Light widget and click Save.
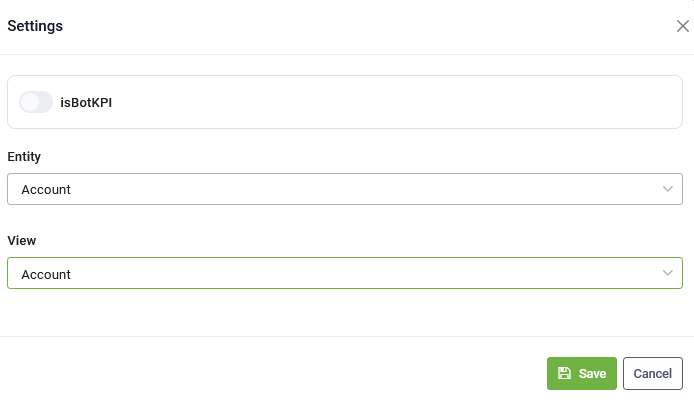
Click the settings icon corresponding to the widget. The widget Settings page appears.
Select the desired entity and entity view and click Save.
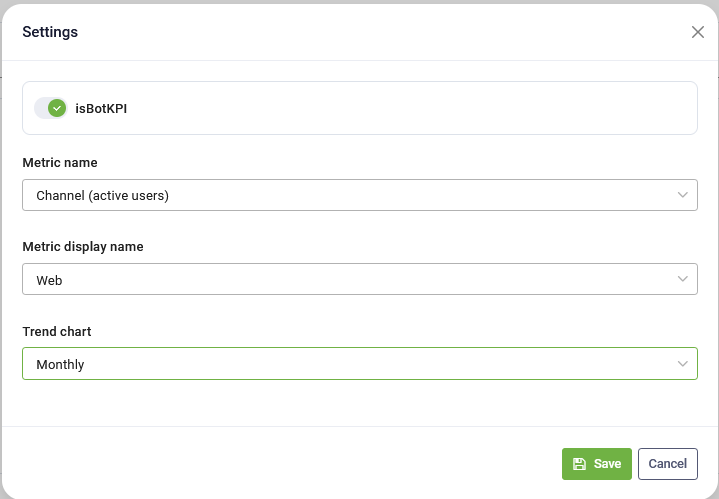
In Druid 9.11 and higher you can choose to Show view names in dashboards for light widgets.


To configure a Light widget to display a bot KPI, go to the widget configuration page, tap on isBotKPI, then select the desired bot metric, metric name, and trend.
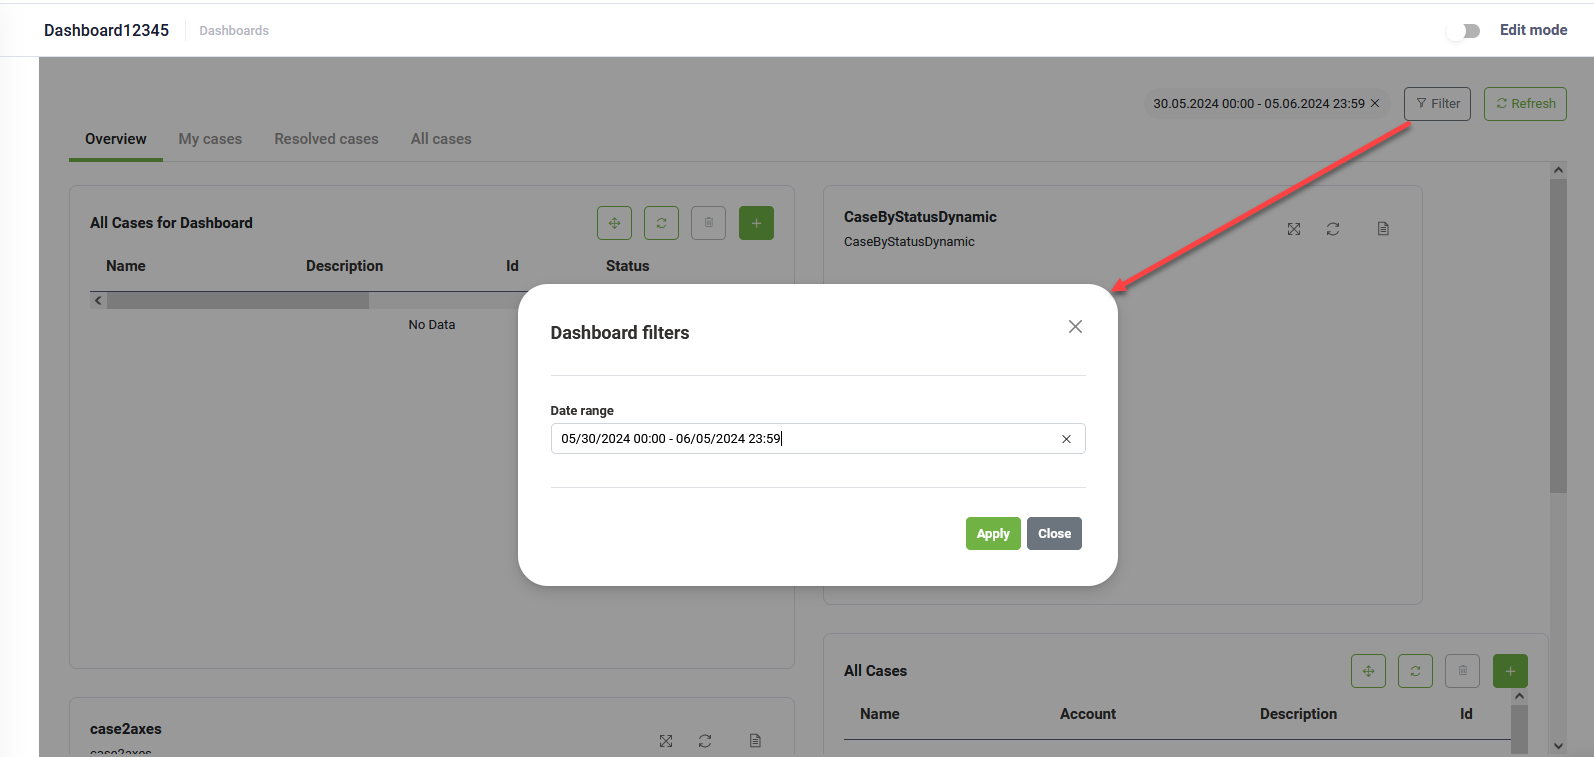
Filtering table records on the dashboard
To filter table records on the dashboard within a specific period:
- Add the fields SearchStartDate and SearchEndDate (DateTime type) to your desired entities.
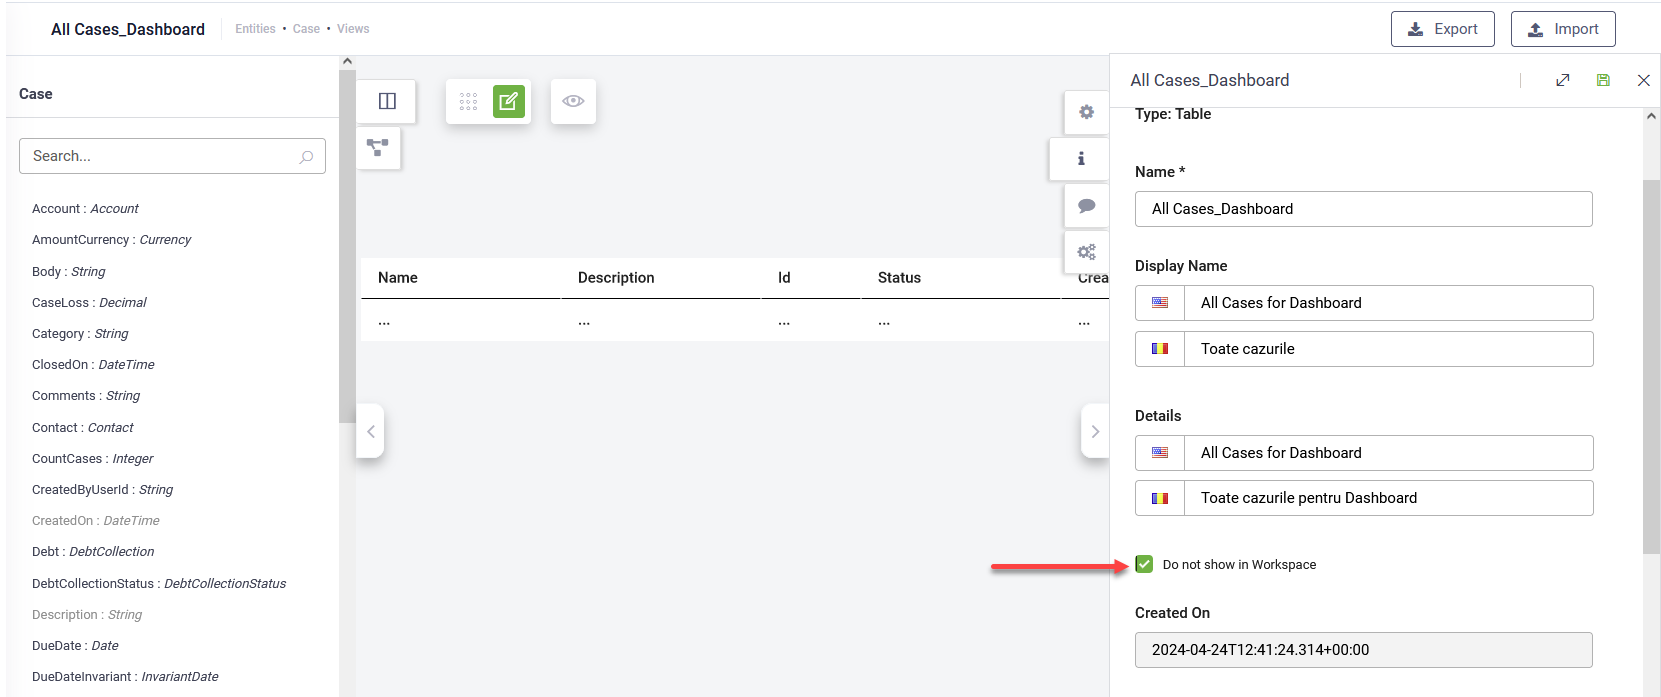
- Create a web view (table) dedicated to custom dashboards and select the option Do not show in Workspace to prevent the view from appearing in the workspace or on the entity > Data tab.
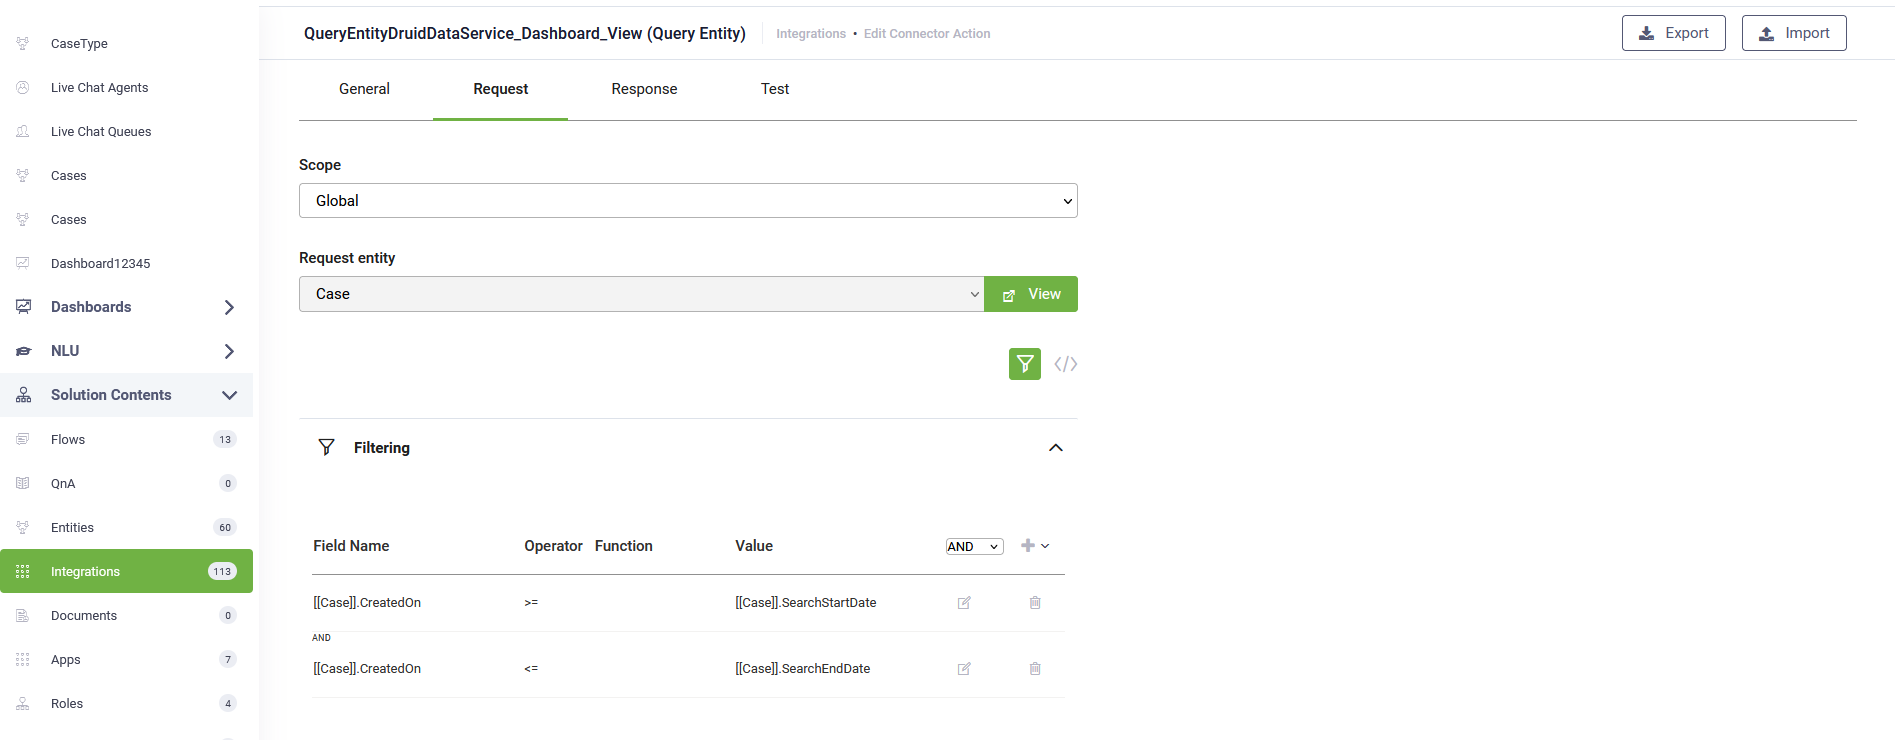
- In the view, add an integration that filters by SearchStartDate and SearchEndDate (>= SearchStartDate and <= SearchEndDate).
- Add this table to the dashboard.
You can now filter records based on a specific period.
Filtering data in dynamic charts
To filter data in dynamic charts on the dashboard:
- Go to the entity where you created the dynamic chart.
- Click the Charts tab.
- Click the dynamic chart you added to the custom dashboard.
- In the General settings, scroll down and select the desired field from Filter By.
- Save the chart configuration.
You can now filter data within a specific period in dynamic charts on the dashboard.
Deleting widgets
To delete a widget from the current dashboard page, click the delete icon corresponding to the desired widget.
Reordering widgets on Dashboard
You can reorder the widgets on a dashboard page by using drag and drop and clicking the Save button on the toolbar.
Adding Dashboard Pages
To add a new dashboard page, click the Add page button ( ) from the toolbar. A pop-up appears. Type the name of the page and click Save. The page is added as a new tab to the dashboard but you remain on the current page.
Renaming Dashboard Pages
To rename the current dashboard page, click the Rename page button ( ) on the toolbar. A pop-up appears. Type the new name of the page and click Save. The new page name is saved.
Deleting Dashboard Pages
To delete the current dashboard page, click the Delete page button (  ) from the toolbar. A confirmation dialog appears.
Click Yes. The current page is removed from the dashboard.